Google Analytics is always the first thing we want to look at for websites to see how well the website is working, what digital marketing activities are being undertaken and what is working.
We work with so many businesses where we need to keep a constant eye on their website statistics and every time we carry out analytics training people are always astounded to find that it can be found in 3 clicks. A lot of important information in analytics doesn’t need to be searched for, it can be found in just one or two pages.
But there’s one particular report that everyone in InSynch (and likely anyone who’s ever been in one of our training courses or webinars) will instinctively go to first.
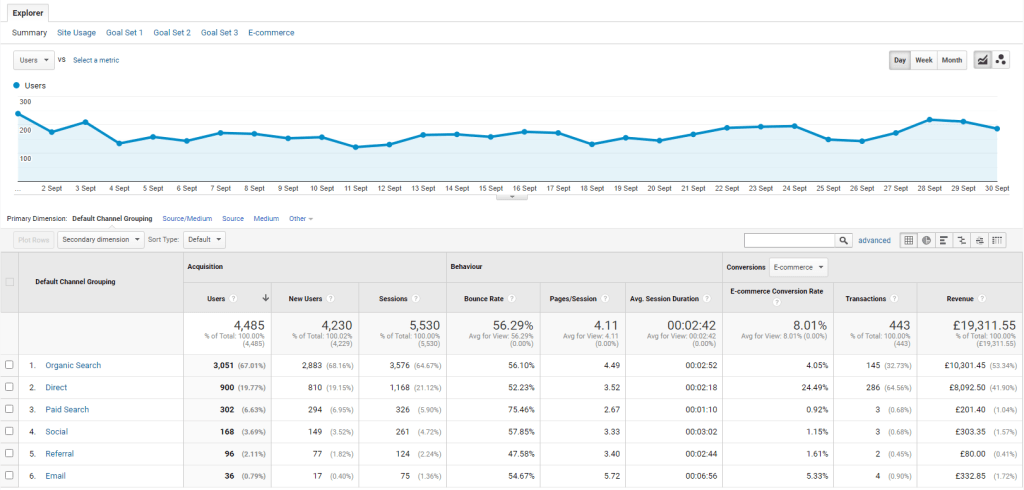
The page I’m referring to is the Channels report. You find this by navigating on to Acquisition > All Traffic > Channels. You will see a screen like the one below:

Instantly this report shows a graph of the traffic day by day (the range of his can be changed on the top right to look over last 30 day, last 7 days, last month etc.) It straight away signals where your traffic is coming from, you see any peaks of traffic from the graph and it gives you information on how people actually use the website.
The only place this may differ is in the Conversions section, on the right of the chart. If you don’t have an e-commerce website (or e-commerce tracking turned on in analytics) then you may have goals here instead, telling you how many people have completed that goal. If there are no goals and no e-commerce set up it will show an empty goals section. (See how to set up goals here)
The different sources/channels of traffic are likely to be as follows:
- Organic search – People that have found you using a search engine by searching for relevant keywords to your business (improve using search engine optimisation)
- Referral – These are people who clicked on a link through to your website from another Website (useful information when you click on Referral here as well which shows which sites bring through traffic)
- Direct – These are users who have typed in your Web address in your browser. (Some social media traffic is actually hidden in here as when people visit from a social media app, often it is recorded as a direct visit)
- Social – Visits from Social media sites such as Facebook, Instagram, Twitter, Pinterest and more
- Email – Providing you have linked your email marketing with Google analytics, link clicks from email newsletters will show here
- Paid search – These are link clicks from paid advertising such as Google Ads or Bing Ads (providing the account is linked in analytics)
- Display – A subsection of paid ads, these are picture/video display ads that are run using Google or Bing Ads
What do you get from this report
In the first column, you can see where Website traffic is coming from in the next three you can see how many people have come from that source of traffic.
This can help you to see which sources of traffic are bringing in more sessions, whether they are staying on the site (look at the bounce rate and average session duration) and even whether they have completed a goal or bought from you (in the Conversions section)
With each of these sources of traffic, you can click on the name in order to see more information. E.g. if you click on Social, it will tell you which social network is bringing you traffic.
Utilise this knowledge
Providing you have Google Analytics Goals set up, it will tell you what the conversion rate is for each visitor. For example, what percentage of visitors from that channel bought something, made an enquiry or looked at over 5 pages on the site. This is extremely helpful in a glance to say e.g. Organic search has brought in the most users, and over 50% of the revenue but Social, and in particular Facebook, brought in the next highest amount of transactions and had a better conversion rate – so we know that we’re putting out the right content on social media that gets people to buy from us.
Want to find this report easily?
Find a report that gives you valuable information, such as the Channels report. Go to the top of the page and click Share. There you can set to have a report emailed to you as a PDF every month/week/day etc. for the next 6 months (can be extended by going into advanced options, up to a year. This can also be renewed at any time in the Admin settings on analytics). This is incredibly handy for people who may forget to come back to this every month or so, and you can instead read it from the comfort of your emails!
If you find that you need more out of analytics, most our Total Digital Marketing packages may be the right fit for you, as we link in a complete digital marketing strategy off the back of the analytics and then work with you to carry out that strategy.
Hear from one of our clients
We work with Black Mountains Smokery on a Total Digital Marketing package and google analytics underpins all the work we do with them. Jo from Black Mountains Smokery said: “Marketing and selling online is a wonderful thing – especially these days when there is a growing interest in provenance. It enables one to promote a brand in a very genuine and honest way. However, what we have learned is that you can have the most beautiful web site – but that is not enough to be an online business. That website has to offer something that the consumer wants, it needs to be well optimised in order to be found and it has to be easy to use. Social media conversations, reviews and conversations enable a business to review what it is doing and respond accordingly.”


